Lyssn’s new data visualization features for all customers
We’re excited to announce several enhancements to our advanced data visualization capabilities. These new features will provide deeper insights into your data through expanded metrics access, enhanced filtering, and more granular search abilities. With these new visualization capabilities, you gain unprecedented flexibility, power, and insight into understanding and leveraging your data. Log in now to explore!
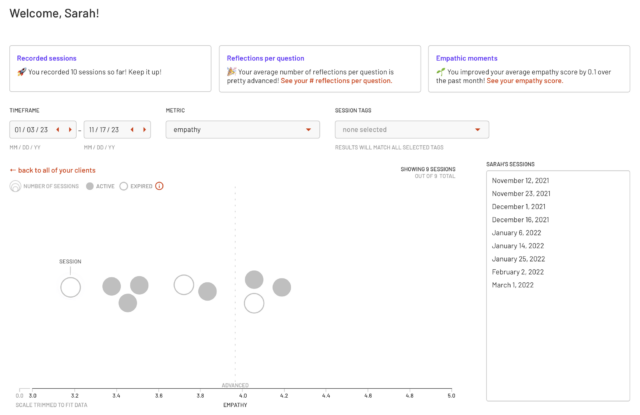
Fine-Tuned Date Range Control
You can now precisely adjust the date ranges for which metrics are displayed, giving you maximum flexibility to analyze trends over multiple sessions.
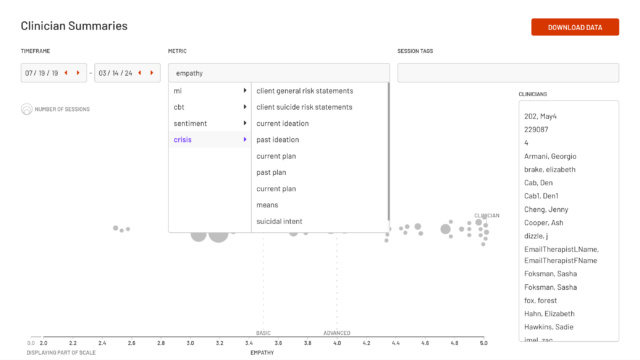
Access to Expanded Metrics
A broad array of additional metrics that were previously unavailable are now accessible through the visualization tools. This includes specialized metrics for MI, CBT, CRISIS, and other key areas depending on the EBP programs your team is using.
Session Tag Filtering
Filter metrics by session tags, allowing you to easily view and compare performance across different cohorts, locations, providers, and more.*
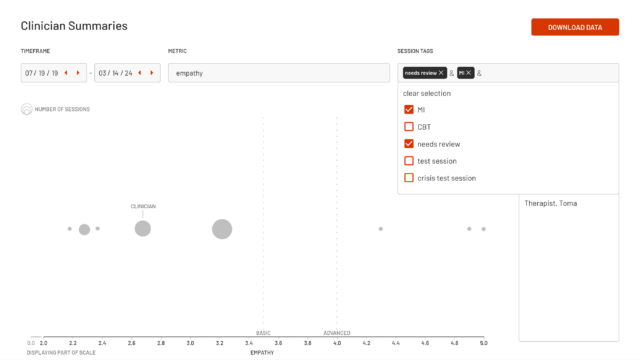
*The default tags list is limited — the potential for tags is largely dependent on custom tags a program adds. To filter by cohort or location, you must create custom tags for your team and manually tag the sessions.
Digital Access to Report Metrics
Metrics that were previously only available for view through downloaded reports can now be explored interactively right within the data visualization interface.
Granular Topic Search
Search for and drill down into metrics related to specific topics and terms, even highly narrow ones such as “smoking.” This can be searched across all sessions and all people.
We value your feedback on how we can continue enhancing our platform to best meet your needs. If you’re a current customer, please email support@lyssn.io if you have any product questions.